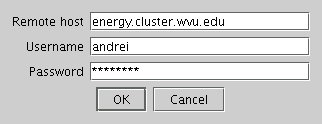
Connection dialog window.
This option copies all the project setup files to the remote host and builds the executables.
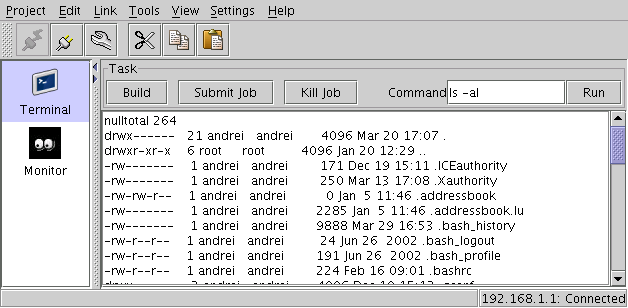
The interface enables the execution of system commands remotely as well as file transfer operations.
As described in Variable setup section of the GUI manual the last field in the variables setup table is a monitoring flag.
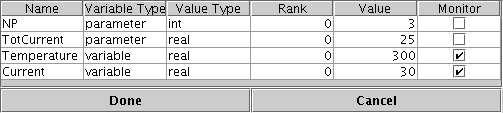
When this flag is active the remote slave process is instructed to dump the sampled data of the respective variable in separate data file. On a multiprocessor system there will be one file corresponding to each processor. The {\em Monitor} menu item in the {\em Link} menu enables viewing of the data.
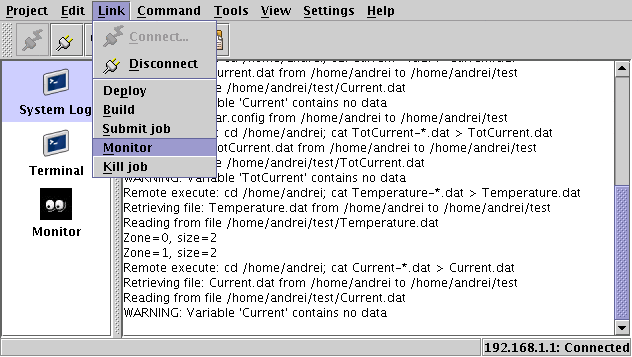
Selecting from this menu will invoke three procedures: (1) data sampling, (2) transfer to local host, (3) visualization on the local host. Visualization of the data will depend on the character of the data sets: the dimensionality of the data, and the rank of the variable. The dimensionality of the data may vary from 0 to 3, representing a single parameter for (0D), a curve (1D), surface (2D), and spacial data (3D). The rank of the variable is used to represent scalars (rank 0 = 0R), vectors (1R), and general n-rank tensors (2,3,..,nR).
When data is of type 1D0R (one-dimensional set of scalars) they will be displayed as a set of curves, each curve corresponding to a different domain (processor).
A separate "2D charts" item in the control panel is activated every time when the sampled data are available for monitoring. By clicking at the "Monitor" icon the cascading panels with charted data will be presented inside the main panel:
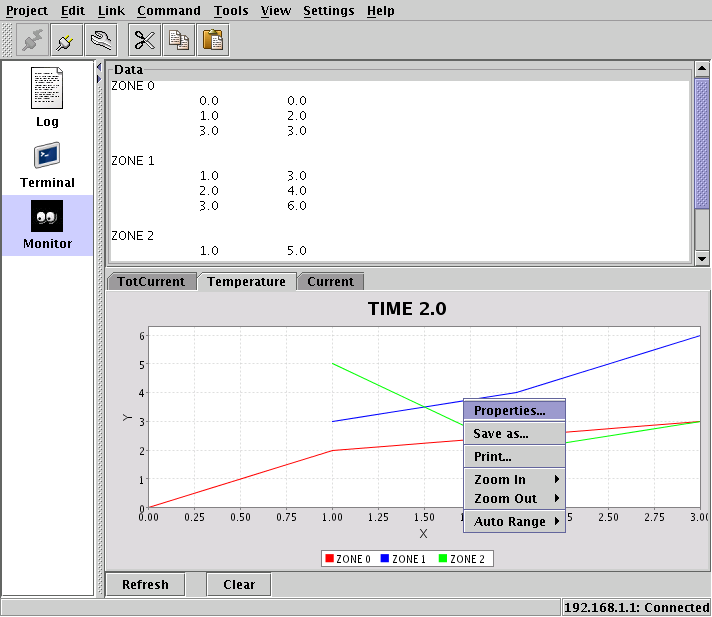
One chart for each variable will show the data sampled from all the processors. The appropriate charts can be selected by clicking at their tabs at the top of the panel.
The raw data will be presented in the upper region of the panel where they can be scrolled. The lower region will present the XY plots of date. By selecting the data point on the chart and clicking at the right mouse button a menu will be displayed enabling zooming, saving and printing options for that data point.
A separate module was introduced into the simulation code, that will use the information from the variables configuration file setup by the GUI code mulphys.com/ring/doc/gui/gui.html#variables to initiate regular data dumps of sampled data. Data file will be created by each processor for each variable marked for monitoring.
This option provides a user-configurable menu of various commands.
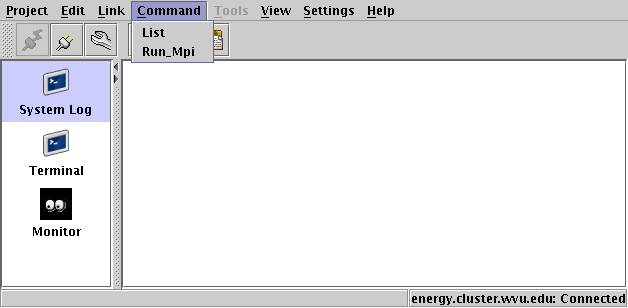
The commands are specified in a separate ascii file in a format
name, command
For example, the line below will create a "MPI run" entry in the menu. When selecting that entry the remote mpirun command will be executed with the number of processors selected from the "var.config" file that was setup in the "Tools->Variable" menu (See Sec. Variable):
Run Mpi, com=$(head -1 var.config | cut -f 5); mpi -np $com
This option enables flexible adjustment of the system for various host-setups and user specific commands. For example, if a remote cluster only enables batch job execution via qsub sytem this can be easily implemented as a user command feature.