GUI
Graphical user interface
by A.Smirnov
This graphical user interface (GUI) was specially developed for
various projects to enable a simple unstructured grid generation and run-time
view of simulated particles and flow-fields. It is based on Open GL graphic library. The currently
implemented GUI features include
-
Unstructured 3D grid generation.
- Complex domain geometry can be constructed from the set of simple graphical primitives (Fig.1a).
- The concept of a drawing tool is used to generate complex
multiple-connected domain (see Fig.1b). This
feature is implemented in a specially designed grid generation module TAGG.
-
Data visualization.
- Choice between a command mode and menu-mode of operation.
- Runtime navigation in a 3D data set using a mouse and/or keyboard control.
- Display of structured and unstructured grids.
- Display of boundary vertices colored according to the boundary type.
- Display of internal grid-nodes.
- Display of boundary edges.
- Display of scalar variables colored by their values.
- Display of vector fields.
- Display of particles colored by selected variable.
- Change of displayed variables or color schemes during runtime.
- Reading initial data in Tecplot or user-defined format.
- Writing data in Tecplot, Ensight or user-defined format.
It should be noted that all the features listed above, except
reading of some initial flow and particle parameters, can be
activated at runtime, i.e. without interrupting an on-going
simulation. This gives an extra convenience of quick overview of
the state of the simulation and saves time in initial problem
setup, since no output file dumps and post-processing is
necessary. It also provides a flexibility of selectively writing
out most interesting results of the simulation or producing a
continuous output for animation purposes.
As an illustration of GUI capabilities is shown in the figures below. Figure [1a] shows a complex domain composed of pre-defined graphics
primitives. Figure [1b] shows the network of bifurcating
tubes related to biomedical applications. Figures [2a],
[2b], [3] show screen-snapshots of
particles and flow-fields produced during simulations. Fig.[2] shows the picture of colliding jets, where the
particles are colored by their injection position, thereby enabling tracing of
individual particles emanating from separate injection points. Fig.[2] shows a 3D vector plot of a turbulent flow-field
generated with the RFG procedure together with a particle stream injected in
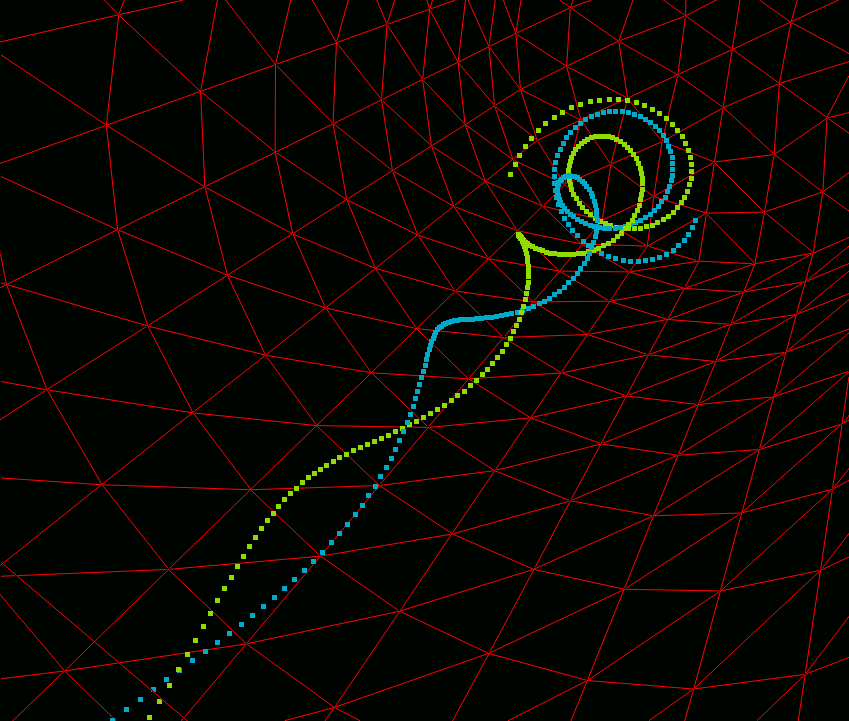
the center of the rectangular domain. Fig.[3] shows a
bubble-distribution in a ship wake, where the bubbles are colored by their
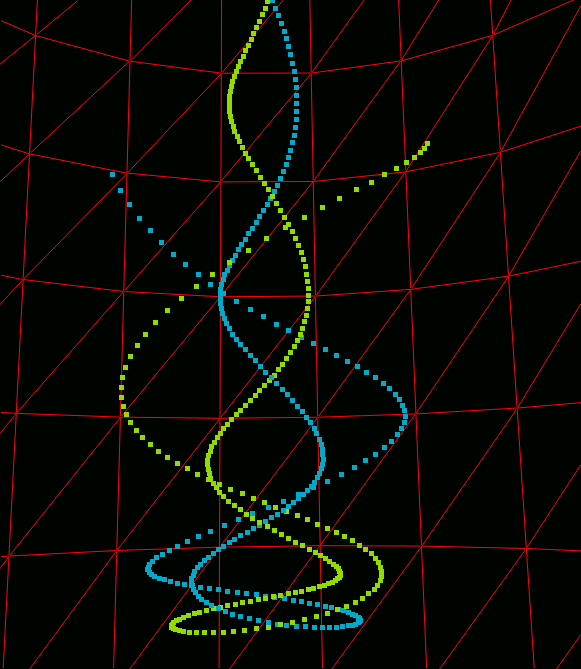
"age", i.e. the time elapsed since their injection into the fluid. Figs.[4,5] show a runtime snapshot of bubble dynamics in
a Rankine-vortex constructed on an unstructured grid.
This GUI was implemented in an ANSI-C language and tested on PC
and DEC Alpha computers under RedHat Linux 6.1 operating system.
Fig.1a
[A composite domain constructed from graphics primitives]
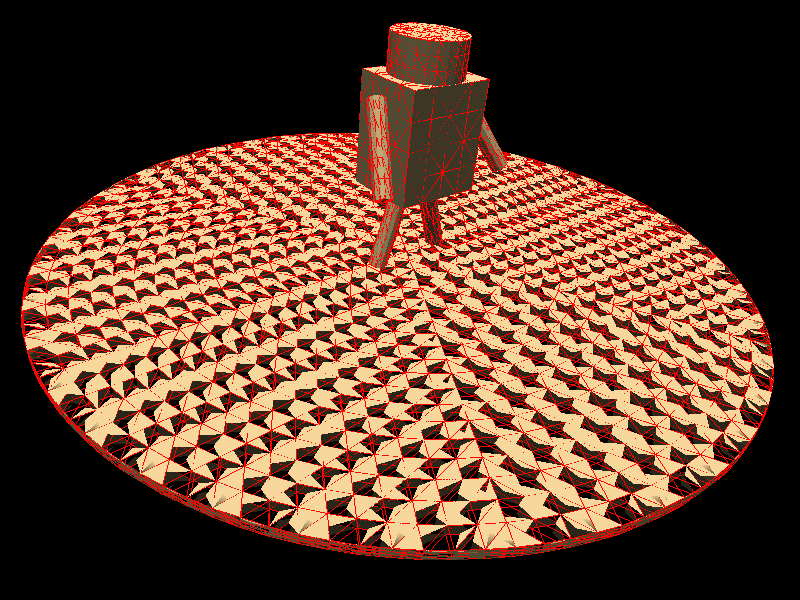
Fig.1b
[Bifurcating tubes, representing blood vessels or airways, (gif animation)]

Fig.1c
[Particle flow in a bifurcating duct]
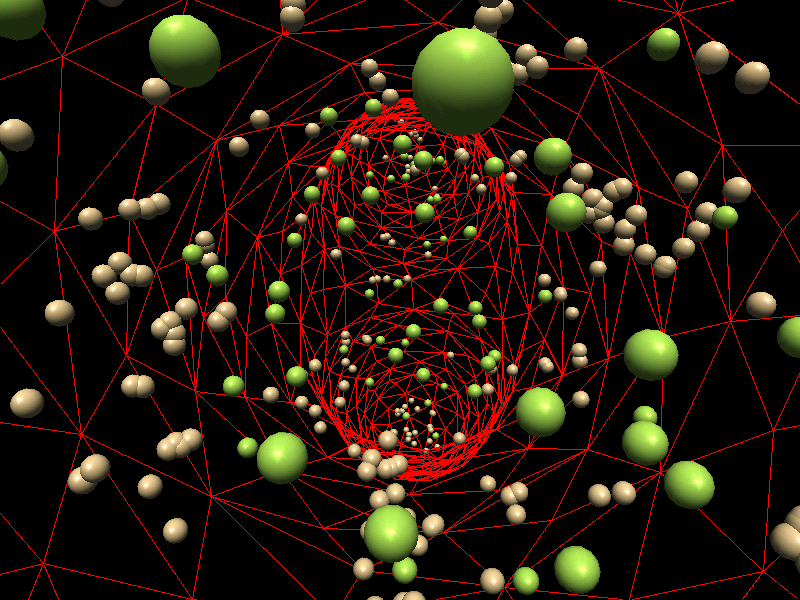
Fig.2a [Impinging jets with no-slip walls]
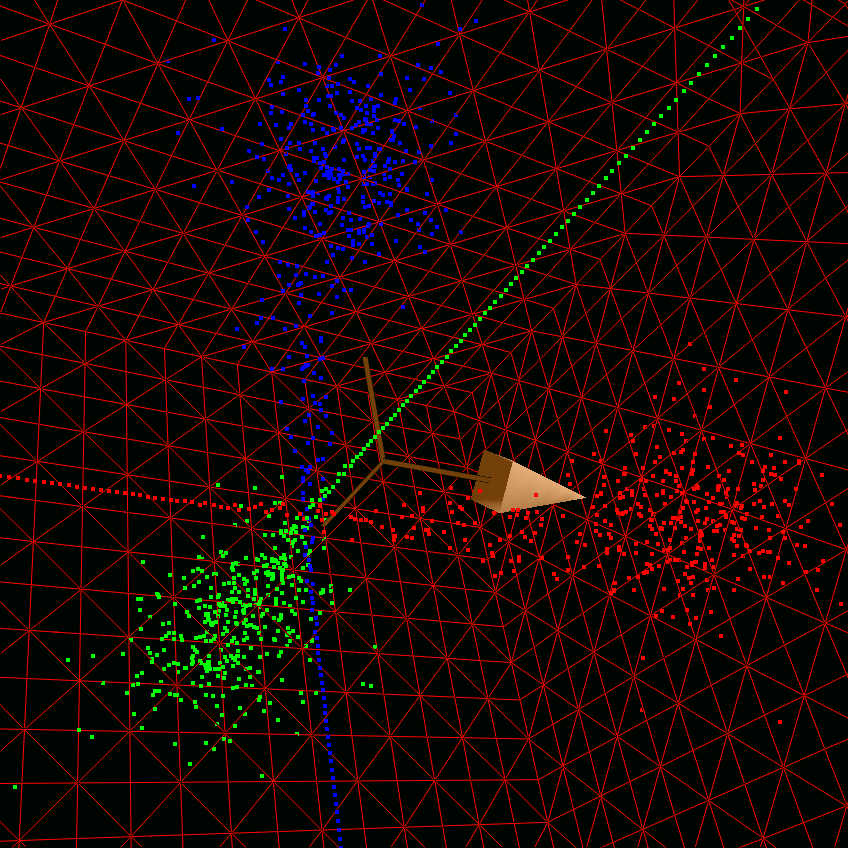
Fig.2b [Particles injected into a turbulent flow field]
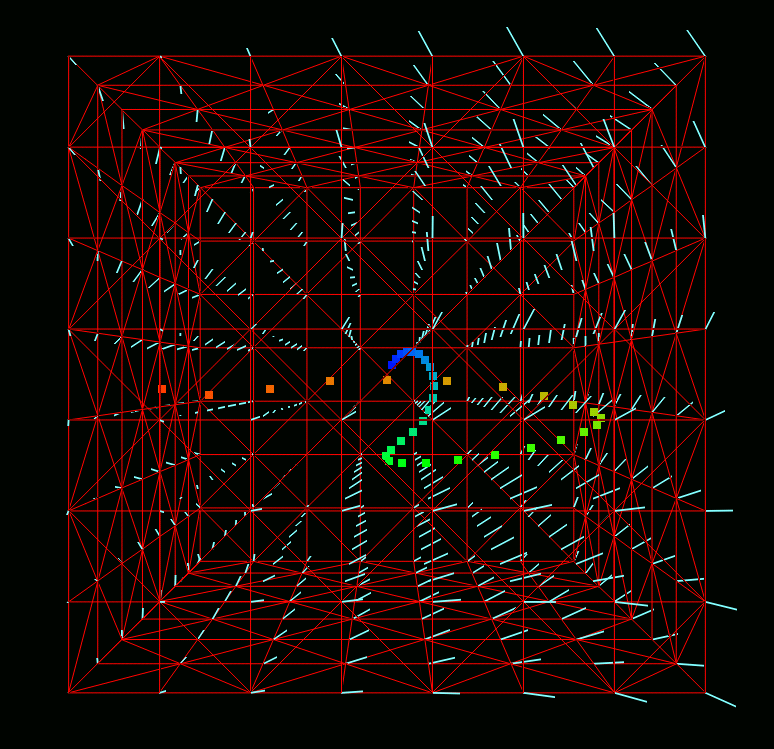
Fig.3 [Bubbles in a ship-wake]
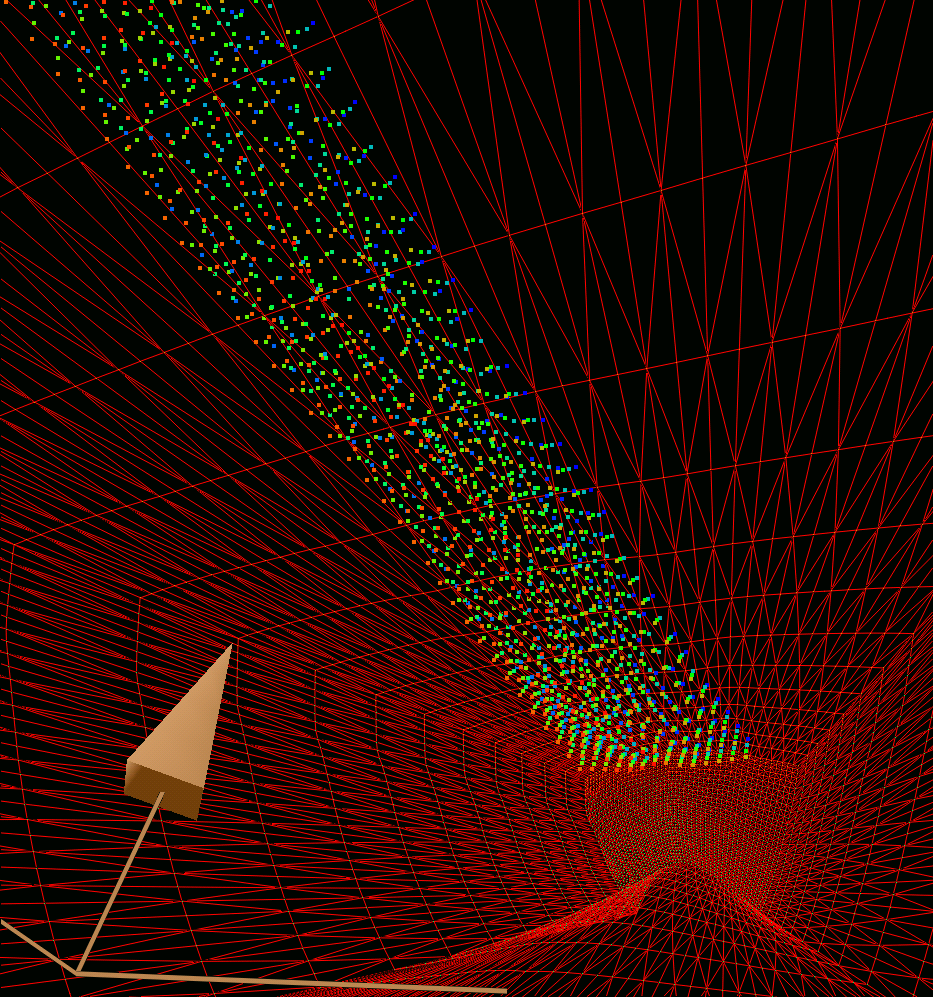
Fig.4 [Bubbles in a Rankine vortex]
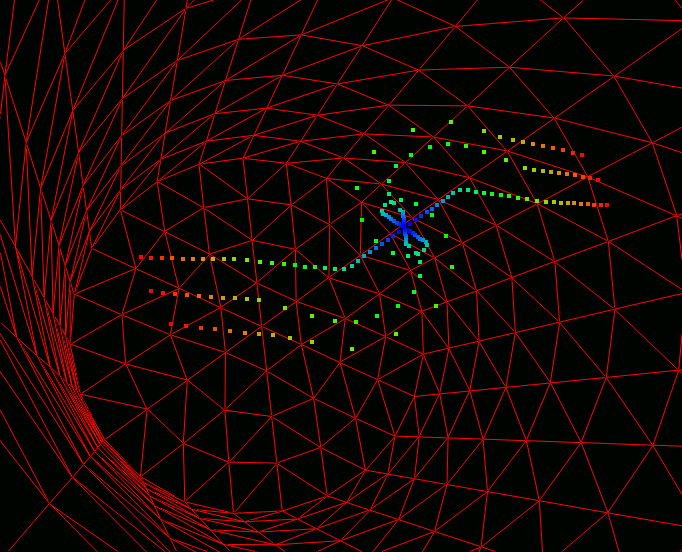
Fig.5 [Bubble trajeectory in a Rankine vortex]
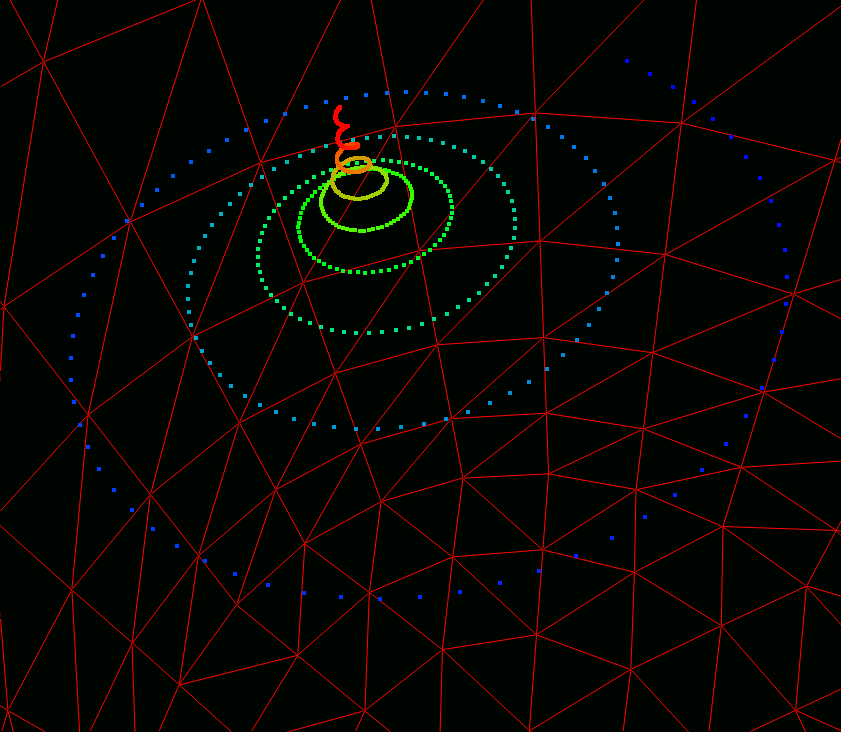
Fig.6 [Two bubbles in a vortex core]